

I bought VEVE for you this morning.
We last sold on 5 August at 108.63, 80 days ago. That's close to our average wait of 83 days.
Since then VEVE set four new highs, reaching 110.42 on 6 October. Each new high moved our buy point up with it.
VEVE came within 1% of our buy point eight times. Yesterday, the ninth time, it tipped over, closing at 106.80, 3.3% below its high.
How it got there matters as much as getting there. My chart below shows the whole journey since we sold in August.
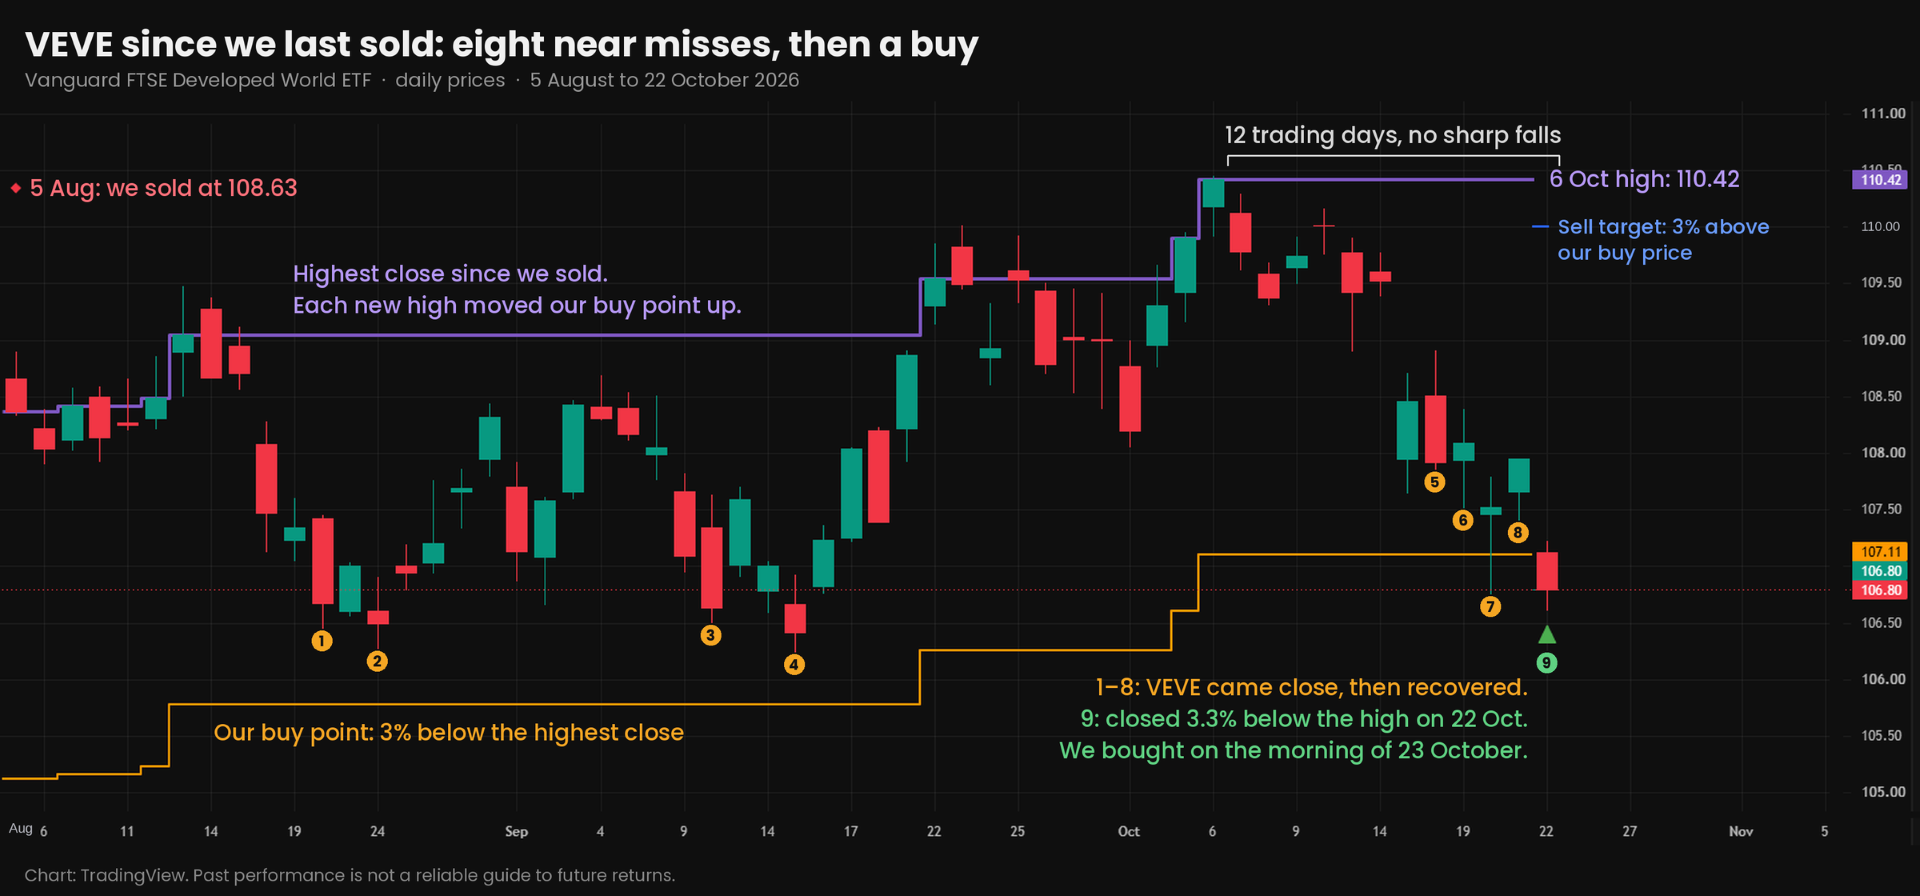
The purple line is VEVE's highest close since we sold. The orange line is our buy point, 3% below that high. The numbered dots are the eight near misses, and the green 9 is where it tipped over and we bought. The short blue line, top right, is our sell target.
The red and green bars are “candles”. Each candle is one trading day. The thick part runs from the opening price to the closing price: green if VEVE rose, red if it fell. The thin lines at either end show the day's high and low, so a longer candle means a bigger move that day.
It took twelve trading days to fall from the October high to our buy point, with no sharp drops along the way.
VEVE wandered lower by just over a quarter of a percent a day. That's the pullback profile this strategy is built for. Fast, sharp falls can be the start of something bigger, and that's when I'd hold off.
Yesterday was a weak day for US shares, tech especially. So before buying, I checked how US markets finished overnight. Nothing had moved sharply, so I went ahead.
VEVE was bought at 106.69, so we'll look to sell once the price rises above 109.89.
There's no telling how long this cycle will take. VEVE may fall further before it recovers. If it does, the plan doesn't change: we sell once it's 3% above what we paid.
The value of investments can fall as well as rise, and you may get back less than you invested. Past performance is not a reliable guide to future returns.